3-D CCP stacking for mantle transition zone structure under the Tibet.
The discontinuities of the 410 and the 660 (D410 and D660) are velocity discontinuities at the bottom of the upper mantle. The receiver function method will provide visible phases to highlight the topography of D410 and D660. The difference in depth between the D410 and D660 (i.e., the mantle transition zone (MTZ) thickness) is correspond to mineral phase transitions and thermal process in the mantle.
Here, we will introduce the usage of the Seispy for imaging the MTZ structure in the central Tibet (Xu et al., 2020).
Download this example
Download link: ex-ccp3d.tar.gz
Download and unzip the file to any directory.
wget https://osf.io/4cga5/download -O ex-ccp3d.tar.gz
tar -xzf ex-ccp3d.tar.gz
The package include:
RFdepth_1D.npy: RF data with time-to-depth conversion with 1-D IASP91 model.ccp.cfg: Configure file for 3-D CCP stacking.ps_mtz.sh: Plot map for topography of D410 and D660 and the MTZ thickness.ps_profile.sh: Plot section with 2-D CCP stacking along a profile.
3-D CCP stacking
Required parameters
Some new parameters in the configure file (ccp.cfg) are exclusive for 3-D CCP stacking. Other parameters are same as the 2-D CCP stacking. See Stack PRFs with Common Conversion points (CCP) method in detail.
peakfile: File to the output depth of the D410 and D660.[spacedbins]: Options for spaced grid of bins.
Initialize grid
Seispy provide a command as the ccp3d for the 3-D CCP stacking.
Before using this command, we will introduce rules of spaced grid.
The section [spacedbins] and option slide_val in the ccp.cfg
controls positions of bins. The center_lat and the center_lon
are the latitude and longitude of the center of study region;
half_len_lat and half_len_lon represent half length in
degree of grid region along the latitude and longitude direction,
respectively; slide_val represent spacing of grid in kilometer.
Note
The option slide_val are shared by the two commands ccp_profile and ccp3d, so the unit is unified as kilometer.
In this step, there is compensation for curvature to avoid distortion at high latitude.
CCP stacking
Run following command in the command line for 3-D CCP stacking.
ccp3d ccp.cfg -s 380/440/630/690
The option
-sdenotes the searching range in depth of the P410s and the P660s.If the
boot_sampleswas set in theccp.cfg, the 95% confidence interval will calculated with the bootstrap method when CCP stacking.boot_samplesrepresent the times of the sample in bootstrapping.
Output files
If -s was set in ccp3d, two files stackfile and peakfile
will be generated, otherwise only stackfile will be generated.
stackfile
As the parameter stackfile set, A npz file will be generated,
which include the stacked data of each bin and the all parameters. We
can read the file in Python script
from seispy.ccp3d import CCP3D

ccp = CCP3D.read_stack_data('/path/to/stackfile')
# ccp.stack_data is a np.ndarray with stacked data of each bin
peakfile
Text file with 10 columns including the Depth information of the D410
and D660. Column 1 and 2 are latitude and longitude of each bin; column
3 is the depth of the D410; column 4 and 5 are confidence interval at the D410 depth if
boot_samples was set in ccp.cfg; column 6 is the ray number of
each bin in this D410 depth; column 7 is the depth of the D660; column 8
and 9 are confidence interval at the D660 depth; column 10 is the ray number of each bin
in this D660 depth
Plot the map of D410, D660 and the MTZ thickness
We have provided a GMT script to plot the map
sh ps_mtz.sh
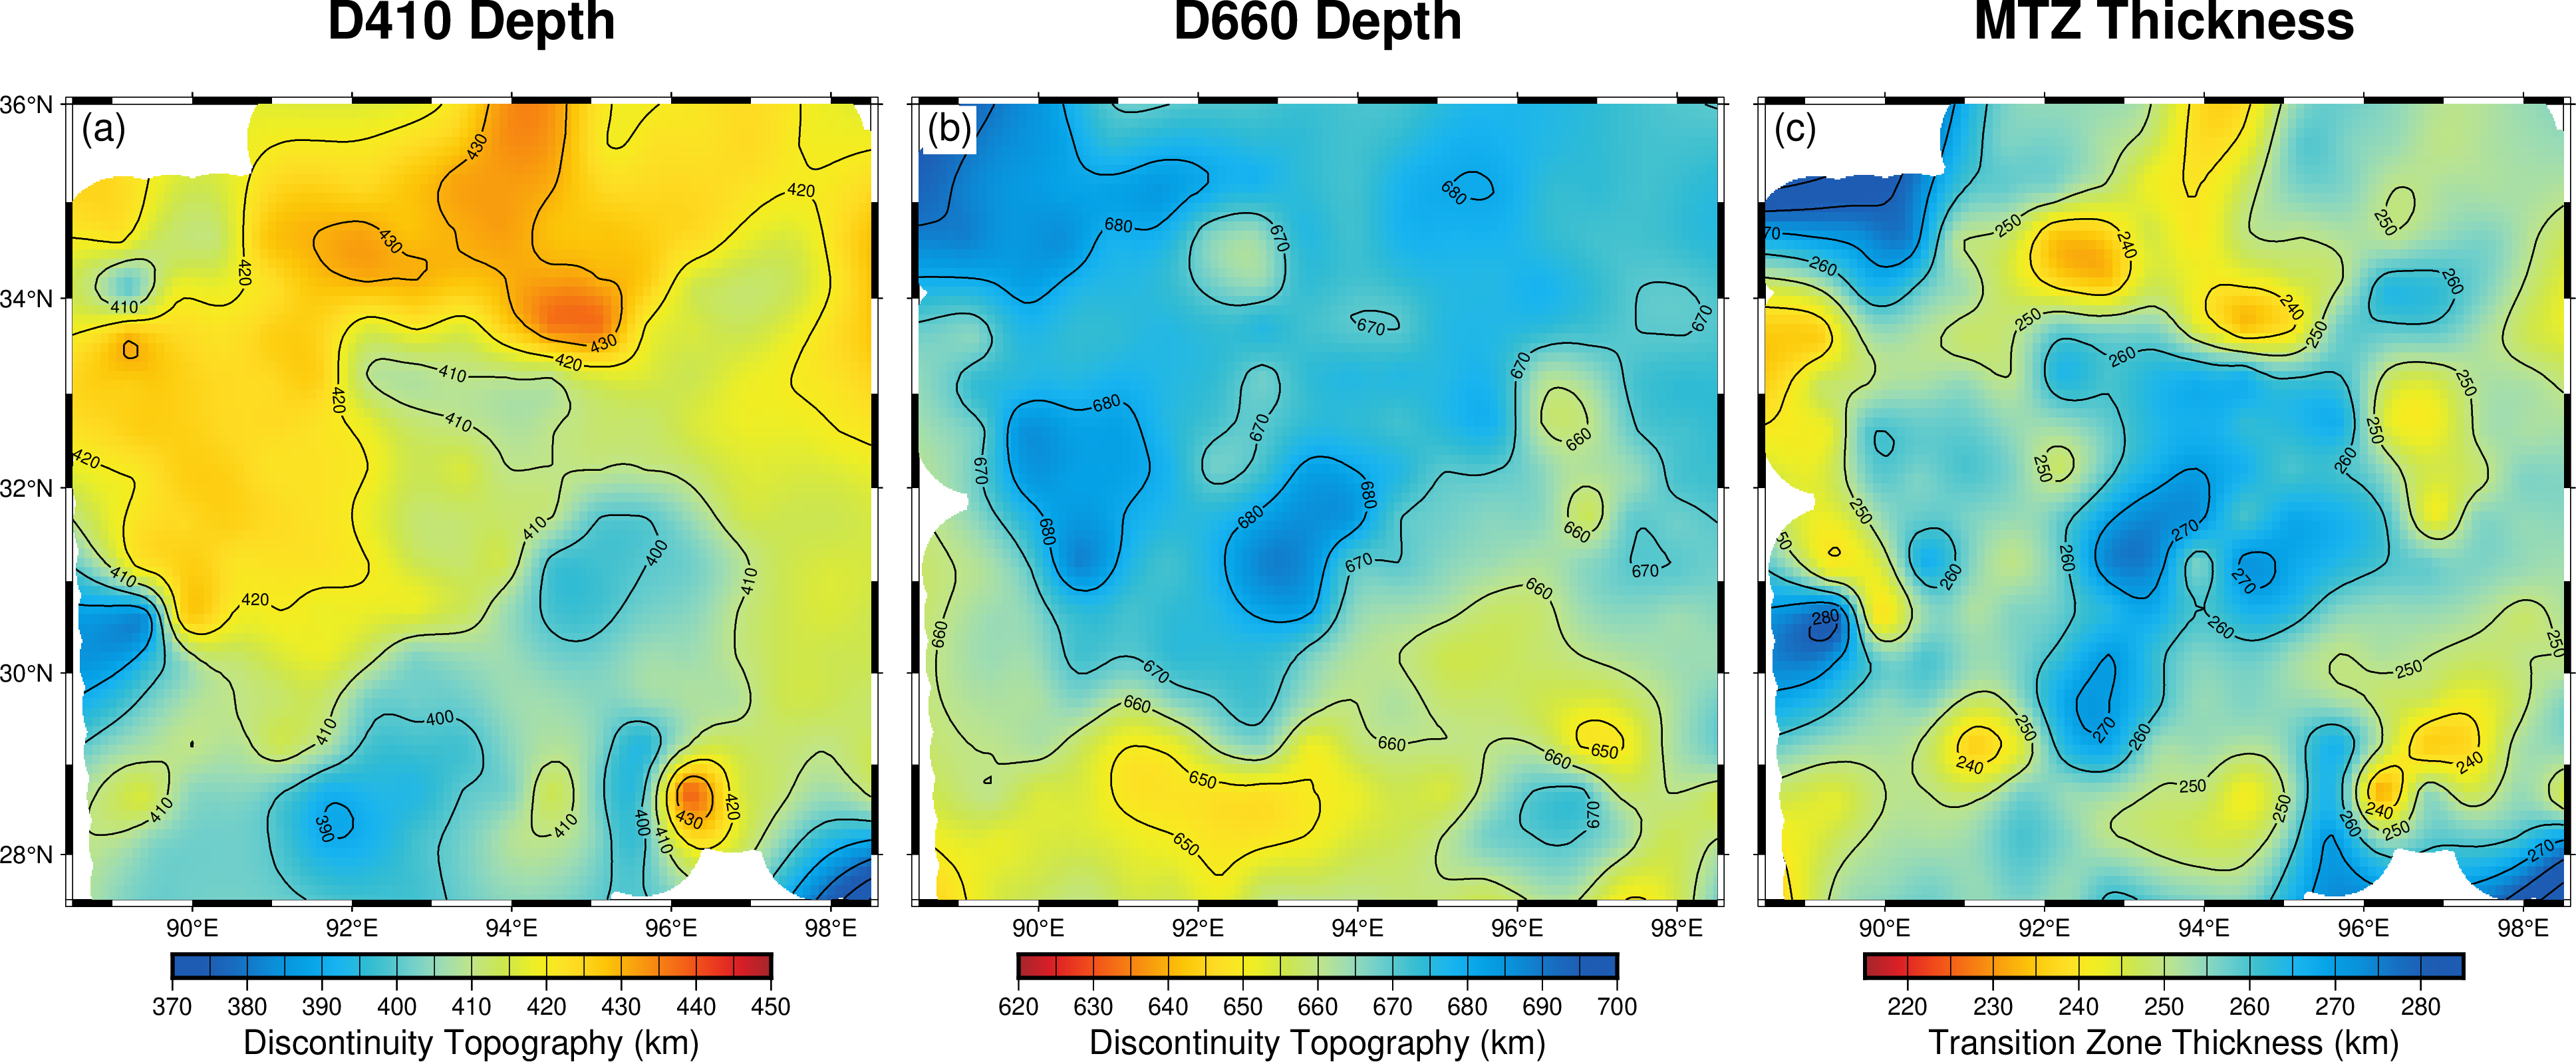
Topographies of the d410, d660 and MTZ thickness
CCP stacking along a profile with bootstrapping
Lateral variations of the topography of D410 and D660 can be imaged by 2-D CCP stacking. To estimate errors of stacked PRFs, we will calculate 95% confidence interval with bootstrap method.
Required parameters
Following parameters are required in the ccp.cfg.
Path to input/output files, including
depthdatandstackfile.The bin
shapewas set tocircle;bin_radiuswas set to 75 km; the interval between adjacent bins (slide_val) was set to 25 km.Two end points of the profile were set in
[line]section.In
[stack]section, We set the stacking from 300 km to 750 km with 2 km interval in depth.The
boot_sampleswas set to 2000 times in bootstrapping.
Run 2-D CCP stacking in command line
Run following command
ccp_profile ccp.cfg -t
The text stackfile will be generated. Use provided GMT script to plot the profile.
sh ps_profile.sh
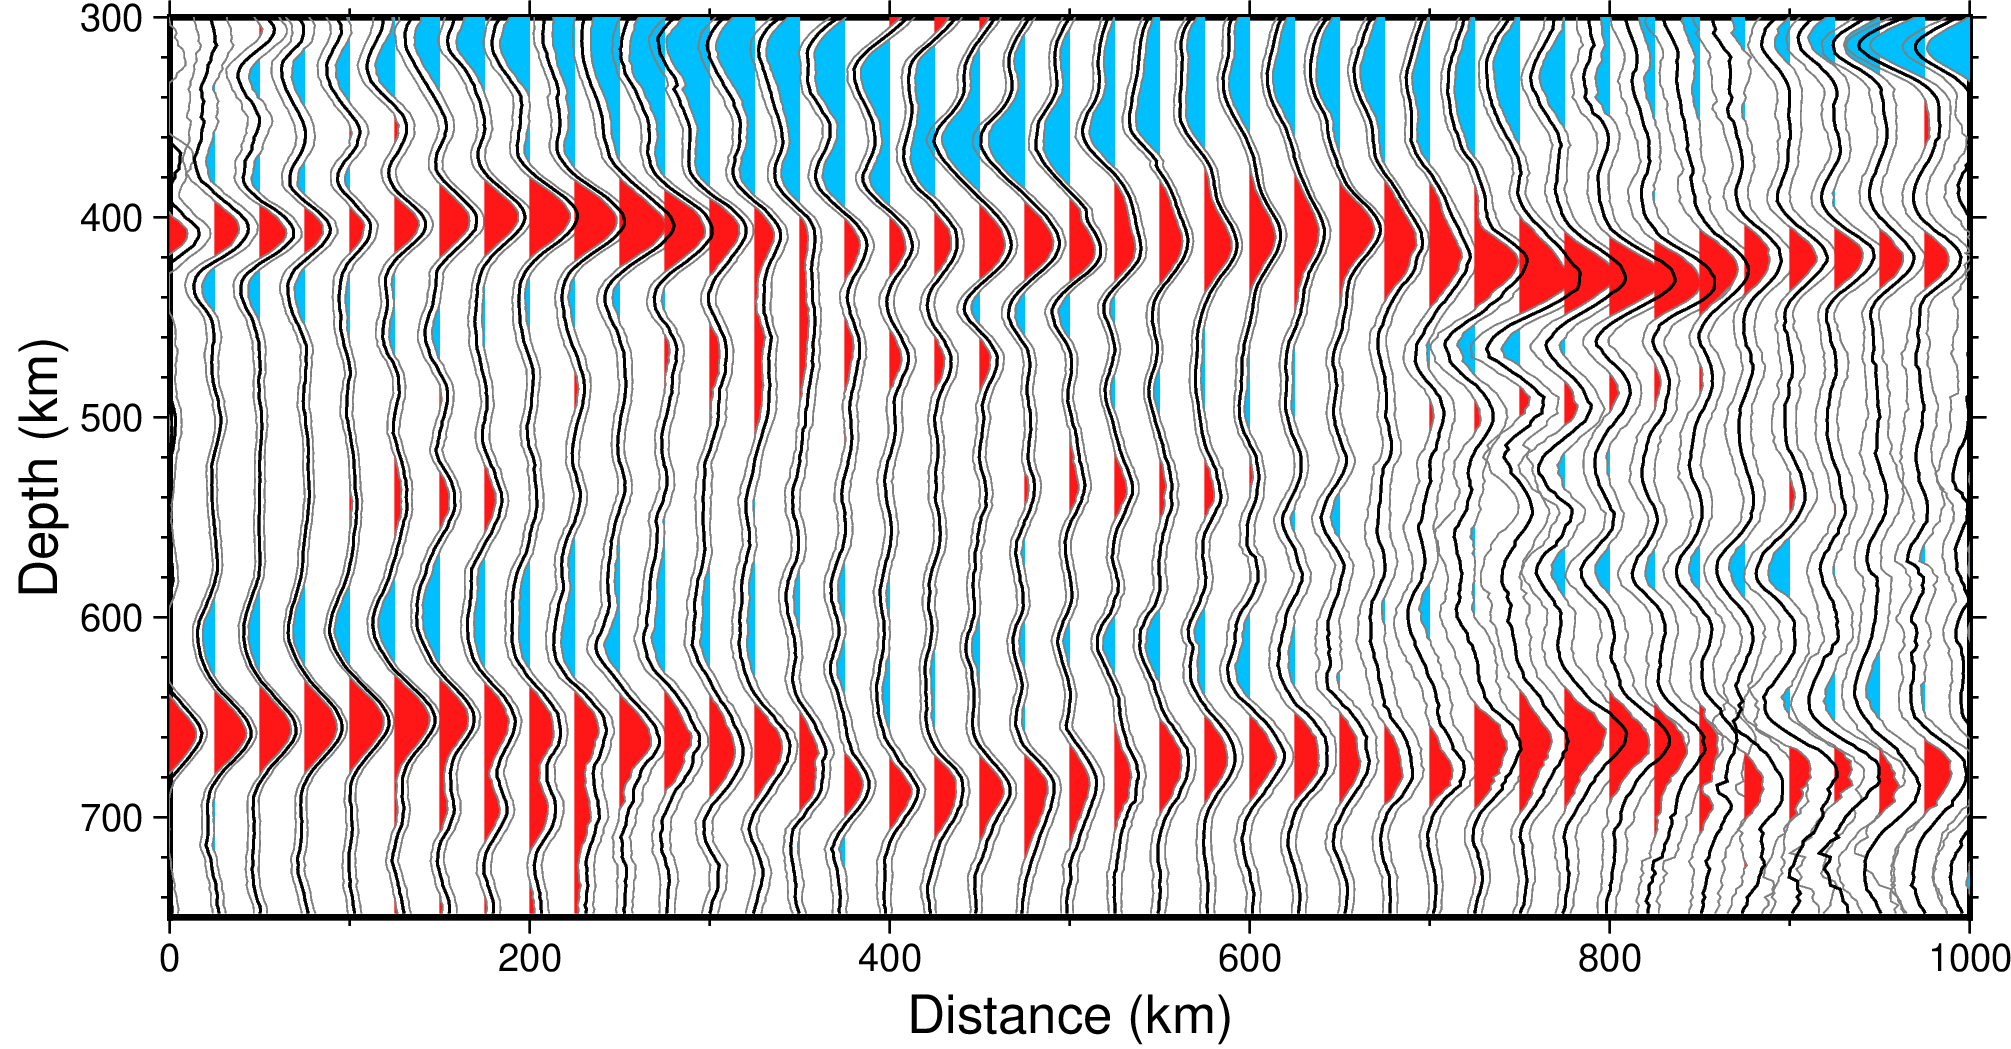
Topography of D410 and D660 along the profile
Reference
Xu M, Huang Z, Wang L, et al. Lateral variation of the mantle transition zone beneath the Tibetan Plateau: Insight into thermal processes during Indian–Asian collision[J]. Physics of the Earth and Planetary Interiors, 2020, 301: 106452.